In preparation for the Chicago move, we are clearing out old and unwanted items. Unwanted furniture and housewares go into the building laundry room, where they are usually adopted within a few hours. But what about those old eyeglasses.
In a paper published in March in the journal Optometry and Vision Science, four researchers compare the full costs of delivering used glasses to the costs of instead delivering ready-made glasses in standard powers (like my drugstore readers, but for myopia as well). The authors find that recycled glasses cost nearly twice as much per usable pair.
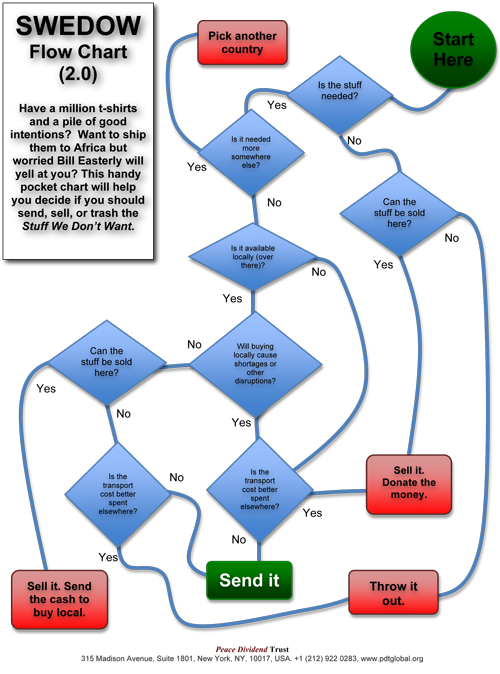
Article. I have not read the original paper, but it jives with the Stuff We Don’t Want (SWEDOW) flowchart from the Development Research Institute:
 If I or the research are somehow mistaken, you still have about a day to let me know.


27 Responses
In preparation for the Chicago move, we are clearing out old and unwanted items. Unwanted furniture and housewares go into the building laundry room, where they are usually adopted within a few hours. But what about those old eyeglasses.
golu dolls
golu dolls
The downside is that the chart becomes less interesting. However, the upside is that the person with 1 million widgets might have more enthusiasm to look at a 2nd chart guiding them through the process of donating the money.
RT @viewfromthecave: This research says that donating your eyeglasses is a waste of money https://t.co/I2CqCMmP78 @cblatts w highlights htt…
RT @viewfromthecave: This research says that donating your eyeglasses is a waste of money https://t.co/I2CqCMmP78 @cblatts w highlights htt…
RT @cblatts: This research says that donating your eyeglasses is a waste of money https://t.co/l3xaKDnlIt
RT @viewfromthecave: This research says that donating your eyeglasses is a waste of money https://t.co/I2CqCMmP78 @cblatts w highlights htt…
RT @viewfromthecave: This research says that donating your eyeglasses is a waste of money https://t.co/I2CqCMmP78 @cblatts w highlights htt…
RT @viewfromthecave: This research says that donating your eyeglasses is a waste of money https://t.co/I2CqCMmP78 @cblatts w highlights htt…
RT @viewfromthecave: This research says that donating your eyeglasses is a waste of money https://t.co/I2CqCMmP78 @cblatts w highlights htt…
RT @viewfromthecave: This research says that donating your eyeglasses is a waste of money https://t.co/I2CqCMmP78 @cblatts w highlights htt…
RT @viewfromthecave: This research says that donating your eyeglasses is a waste of money https://t.co/I2CqCMmP78 @cblatts w highlights htt…
RT @viewfromthecave: This research says that donating your eyeglasses is a waste of money https://t.co/I2CqCMmP78 @cblatts w highlights htt…
RT @viewfromthecave: This research says that donating your eyeglasses is a waste of money https://t.co/I2CqCMmP78 @cblatts w highlights htt…
RT @viewfromthecave: This research says that donating your eyeglasses is a waste of money https://t.co/I2CqCMmP78 @cblatts w highlights htt…
RT @viewfromthecave: This research says that donating your eyeglasses is a waste of money https://t.co/I2CqCMmP78 @cblatts w highlights htt…
RT @viewfromthecave: This research says that donating your eyeglasses is a waste of money https://t.co/I2CqCMmP78 @cblatts w highlights htt…
This research says that donating your eyeglasses is a waste of money https://t.co/I2CqCMmP78 @cblatts w highlights https://t.co/CDd7ZUNErt
RT @cblatts: This research says that donating your eyeglasses is a waste of money https://t.co/l3xaKDnlIt
This research says that donating your eyeglasses is a waste of money https://t.co/GfuYaNw52t
RT @cblatts: This research says that donating your eyeglasses is a waste of money https://t.co/l3xaKDnlIt
@laurafreschi @cblatts Ahem. that should read
‘@Scott_Gilmore’
Ahem, that should be @Scott_Gilmore
Thanks for that Chris. Nice chart by @ScottGilmmore and @laurafreschi. One minor quibble: the question immediately above “Send it” should direct “Yes” to “Can the stuff be sold here?” (top right) rather than straight to “Sell it. Donate the money”.
A more substantial problem is that someone with 1 million widgets will rarely have the contacts or inclination to find the right local individual or organisation to send the money to in order that they can buy widgets locally and distribute them.
If you replace “Sell it. Send the cash to buy local.” with “Sell it. Donate the money.”, then the chart becomes greatly simplified. As well as getting rid of one of the red squares, you can delete the 3 diamonds under “Is it needed more somewhere else?” and go straight to the left-hand “Can the stuff be sold here?” (Yes -> sell. No –> transport cost question).
The downside is that the chart becomes less interesting. However, the upside is that the person with 1 million widgets might have more enthusiasm to look at a 2nd chart guiding them through the process of donating the money.
RT @cblatts: This research says that donating your eyeglasses is a waste of money https://t.co/l3xaKDnlIt
RT @cblatts: This research says that donating your eyeglasses is a waste of money https://t.co/l3xaKDnlIt
RT @cblatts: This research says that donating your eyeglasses is a waste of money https://t.co/l3xaKDnlIt
RT @cblatts: This research says that donating your eyeglasses is a waste of money https://t.co/l3xaKDnlIt